 RollPoll
The guide · Section 9 of 15
Questions about your voters
Asking voters about themselves — ready-made questions, required or optional — and, once the poll closes, one chart of how each group voted, to share, print or download.
What it's for
About your voters asks voters a little about themselves — their age range, their area, their role in the club. When the poll closes, you see the choices broken down by the answers: how each age range voted, say.
The questions are asked on the voting page, under the choices, headed About you. Under that heading the voting page says: Your answers are counted only as totals by group, after the poll closes. They may be shown on the public results. They can change while the poll is a draft. From the moment it opens, they're fixed.
Add questions
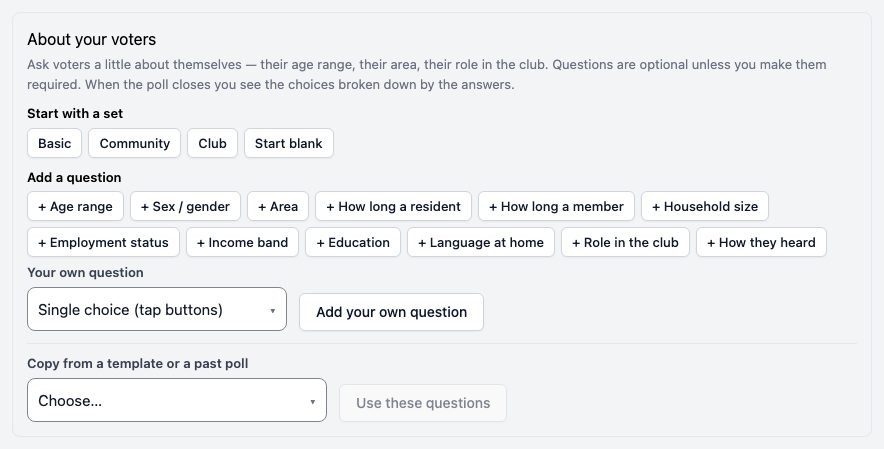
- Start with a set — Basic, Community or Club: a few ready-made questions at once. Start blank clears them.
- Add a question — one ready-made question at a time: + Age range, + Area, + How long a member, + Role in the club and more.
- Your own question — write your own, choose its kind (single choice, a dropdown, tick all that apply, a number, a scale, yes or no, text, a postal code), and press Add your own question.
- Copy from a template or a past poll — pick one and press Use these questions.
Required or optional
Each question is optional unless you tick Required. An optional one is marked (optional) on the voting page, and voters can leave it empty. A required one is marked Required in red, and the vote can't go on without an answer.
Each question also has Help text (optional). Once an earlier question has choices, a later one has Show only if: ask it only of voters who gave a certain answer to the earlier one.
While the poll is open
The answers are sealed. Nobody sees an answer or a total while the poll is open — not even you.
After it closes: one screen
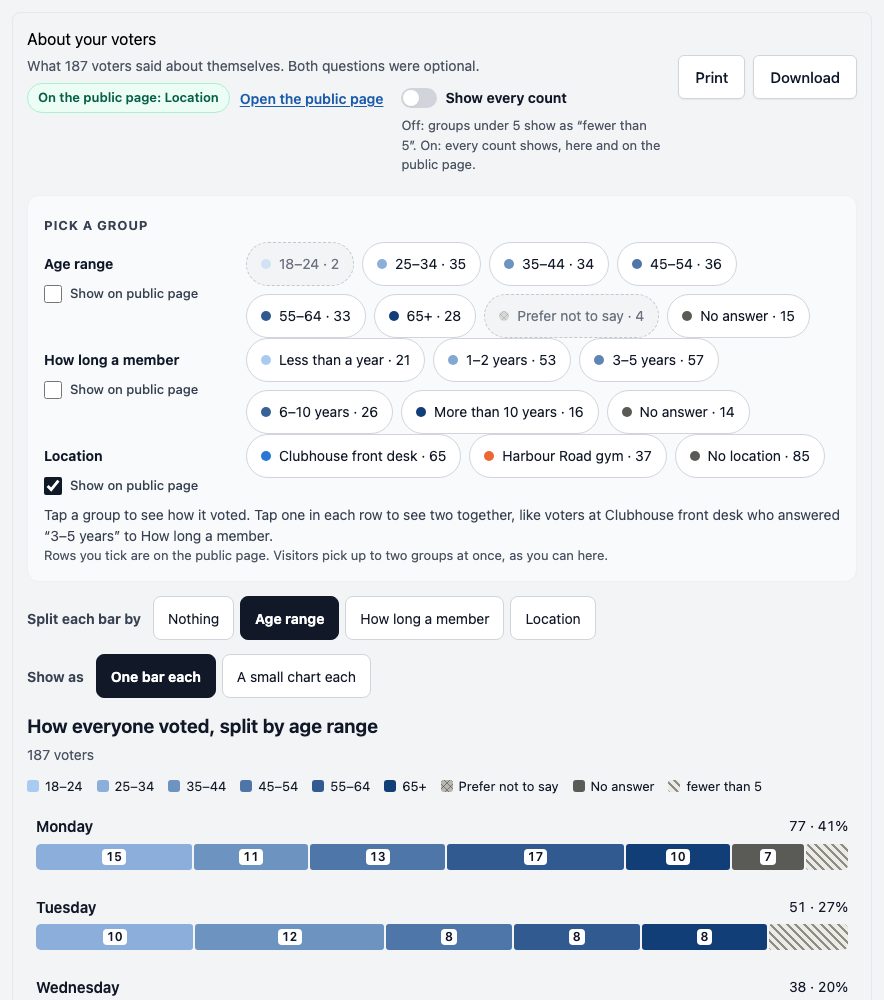
When the poll closes, About your voters becomes one screen with one chart. At the top it says how many voters answered, and whether anything is on the public results page. Beside that is a switch, Show every count. Two buttons sit at the top too: Print and Download.
For a minute or two after a poll closes, it says Working out the breakdowns — this takes a minute or two after a poll closes. The screen fills in by itself when it's done; you don't need to reload.
Pick a group
Under Pick a group there is one row of buttons for each question about your voters, such as Age range and Sex / gender. Each button shows a group and a number, like Male · 219. The number is how many voters the chart would show if you tapped it.
If any votes came in through your locations' codes, there is a Location row after the questions. It has a button for each of your places, by its name, in the order you added them, and No location for votes that came through no place, such as your poll's own link. A place is a group like any other: tap Clubhouse front desk to see how the people who voted there voted, or tap it and 35–44 to see voters at Clubhouse front desk aged 35–44.
If your poll's locations have location tags, there is a row for each tag as well, such as Area (where they voted). Only you see those rows.
- Tap a group to see how it voted. Tap it again to go back to everyone.
- Tap a group in another row to see two together, like Male voters aged 65 and over. The buttons then show how many voters are in both.
- Two groups is the most at once. The other rows grey out with Not now: two groups is the most at once. Tap either picked group to drop it, or press Clear to drop both.
Beside each question's name, and beside Location, there is a box, Show on public page. See Show on public page, Print and Download below.
The chart
The chart's title says whose votes it shows, like How Male voters voted, with how many voters that is. There is one bar for each choice, in the order of the ballot, with its count and its share of the voters shown. The chart takes the colour of the group you tapped last.
A chart is a pie only where one reads well: each voter gave one answer, there are 2 to 4 parts, every part is shown, and the biggest is at least one and a half times the next. Everywhere else it is bars.
Split each bar by splits each bar by a row's groups: a question's, or your places'. The screen opens split by the first question. Under Show as, One bar each puts each choice's bar end to end, one piece per group in its colour; A small chart each draws a small chart for each choice, all on one scale. Picking a group turns the split off. With two groups picked, the bars can't be split.
Colours stay with the group: Male blue, Female orange, Other aqua; an age range or a number of years is one blue, light to dark; No answer is grey. Printed in black and white, the colours get stripes.
Who voted for a choice
Tap a choice's bar to see who voted for it: one small chart for each row you haven't picked, Location included, as shares of that choice's voters. Tap it again, or press Close, to close it. With two groups picked, this isn't offered.
Groups under 5, and Show every count
A group or count under 5 shows as “fewer than 5”. Every count of 5 or more always shows. When anything on screen shows as “fewer than 5”, one line under the chart says Groups under 5 show as “fewer than 5”.
Your own buttons show each group's exact total, even under 5, when nothing else is picked. A group under 5 can't be tapped, and the public page shows “fewer than 5” instead.
Show every count sits at the top, beside the public label; on a phone, under it. It starts off on every poll. Turn it on and every count shows exactly, groups under 5 included: on your screen, in print, in the download, and on the public page for the questions you show there. A group under 5 can then be tapped like any other. Turn it off and groups under 5 show as “fewer than 5” again. It happens as soon as you flip it: there is nothing to save. It's there only once the poll has closed.
Show on public page, Print and Download
- Show on public page — tick the box beside a question, or beside Location, to put that row on the public results page. It happens as soon as you tick it: there is nothing to save. A line under the top says what is on the public page now. Tick as many rows as you like. Under the rows the screen says Rows you tick are on the public page. Visitors pick up to two groups at once, as you can here. Each visitor picks their own two, like voters at Harbour Road gym aged 25–34. Untick a box to take that row off; untick them all to take it all off. Nothing else changes what is shared: picking groups or splitting the bars never does. When the poll closes, Location starts ticked if your poll shows How many votes came from each place. Location tag rows have no box: they are never shown to the public. When something is shown, Open the public page opens the real thing in a new tab.
- Print prints the chart on screen: the poll's title, when it closed and how many voted, the chart, a choice's voters if they're open, and the groups you picked. Print it, or save it as a PDF from the print window.
- Download saves the numbers of the chart on screen as a spreadsheet file (CSV), as the screen shows them. With nothing picked, it also has each group's exact total.
The public page and your phone
The public results page shows the same screen for the rows you shared, headed About the voters, with Print. It has no boxes, no switch and no Download. Its buttons show “fewer than 5” instead of exact small totals, unless Show every count is on. If this poll is shown on your organizer page, it shows there too.
On a phone, Show every count sits under the public label, and each row's name sits above its box and its buttons. A picked row folds down to its pick, with ✕ to drop it and Change to open its buttons again.
While a poll is open with its results sealed, as an exit poll's are, nobody sees a chart, not even you. If it is cancelled before it closes, nobody ever does.
Each voter is counted once. On a ranked poll the charts count first choices. On a poll where voters could pick more than one, they are bars only. On a weighted poll each voter counts once, not by weight. Each of these says so above the chart.
Written answers aren't charted; they're listed on Raw data, beside each vote.
Still stuck? Signed in, use Contact RollPoll. Not signed in, Contact us.